Summary
White wine has existed for at least 2500 years. The sommelier - subject-matter expert on wine - learns and practices hard to understand the topic. I'm going to gain some knowledge of wine by conducting the exploratory data analysis of the data set with the physicochemical and quality of the wine.
Citation
This dataset is public available for research. The details are described in [Cortez et al., 2009].
P. Cortez, A. Cerdeira, F. Almeida, T. Matos and J. Reis. Modeling wine preferences by data mining from physicochemical properties. In Decision Support Systems, Elsevier, 47(4):547-553. ISSN: 0167-9236.
Available at: [@Elsevier] http://dx.doi.org/10.1016/j.dss.2009.05.016 [Pre-press (pdf)] http://www3.dsi.uminho.pt/pcortez/winequality09.pdf [bib] http://www3.dsi.uminho.pt/pcortez/dss09.bib
Dataset
This data set contains 4,898 white wines with 11 variables on quantifying the chemical properties of each wine. At least 3 wine experts rated the quality of each wine, providing a rating between 0 (very bad) and 10 (very excellent).
## 'data.frame':    4898 obs. of  13 variables:
##  $ X                   : int  1 2 3 4 5 6 7 8 9 10 ...
##  $ fixed.acidity       : num  7,0 6,3 8,1 7,2 7,2 8,1 6,2 7,0 6,3 8,1 ...
##  $ volatile.acidity    : num  0,27 0,30 0,28 0,23 0,23 0,28 0,32 0,27 0,30 0,22 ...
##  $ citric.acid         : num  0,36 0,34 0,40 0,32 0,32 0,40 0,16 0,36 0,34 0,43 ...
##  $ residual.sugar      : num  20,7 1,6 6,9 8,5 8,5 6,9 7,0 20,7 1,6 1,5 ...
##  $ chlorides           : num  0,045 0,049 0,050 0,058 0,058 0,050 0,045 0,045 0,049 0,044 ...
##  $ free.sulfur.dioxide : num  45 14 30 47 47 30 30 45 14 28 ...
##  $ total.sulfur.dioxide: num  170 132 97 186 186 97 136 170 132 129 ...
##  $ density             : num  1,001 0,994 0,995 0,996 0,996 ...
##  $ pH                  : num  3,00 3,30 3,26 3,19 3,19 3,26 3,18 3,00 3,30 3,22 ...
##  $ sulphates           : num  0,45 0,49 0,44 0,40 0,40 0,44 0,47 0,45 0,49 0,45 ...
##  $ alcohol             : num  8,8 9,5 10,1 9,9 9,9 10,1 9,6 8,8 9,5 11,0 ...
##  $ quality             : int  6 6 6 6 6 6 6 6 6 6 ...
All the independent variables are numerics and the quality - expert review - is integer. If might be helpful for the further exploration to operate quality as a factor variable, so I createthe new variable and call it quality.factor.
## Factor w/ 7 levels "3","4","5","6",..: 4 4 4 4 4 4 4 4 4 4 ...
##  fixed.acidity    volatile.acidity  citric.acid     residual.sugar
##  Min.   : 3,800   Min.   :0,0800   Min.   :0,0000   Min.   : 0,600
##  1st Qu.: 6,300   1st Qu.:0,2100   1st Qu.:0,2700   1st Qu.: 1,700
##  Median : 6,800   Median :0,2600   Median :0,3200   Median : 5,200
##  Mean   : 6,855   Mean   :0,2782   Mean   :0,3342   Mean   : 6,391
##  3rd Qu.: 7,300   3rd Qu.:0,3200   3rd Qu.:0,3900   3rd Qu.: 9,900
##  Max.   :14,200   Max.   :1,1000   Max.   :1,6600   Max.   :65,800
##
##    chlorides       free.sulfur.dioxide total.sulfur.dioxide
##  Min.   :0,00900   Min.   :  2,00      Min.   :  9,0
##  1st Qu.:0,03600   1st Qu.: 23,00      1st Qu.:108,0
##  Median :0,04300   Median : 34,00      Median :134,0
##  Mean   :0,04577   Mean   : 35,31      Mean   :138,4
##  3rd Qu.:0,05000   3rd Qu.: 46,00      3rd Qu.:167,0
##  Max.   :0,34600   Max.   :289,00      Max.   :440,0
##
##     density             pH          sulphates         alcohol
##  Min.   :0,9871   Min.   :2,720   Min.   :0,2200   Min.   : 8,00
##  1st Qu.:0,9917   1st Qu.:3,090   1st Qu.:0,4100   1st Qu.: 9,50
##  Median :0,9937   Median :3,180   Median :0,4700   Median :10,40
##  Mean   :0,9940   Mean   :3,188   Mean   :0,4898   Mean   :10,51
##  3rd Qu.:0,9961   3rd Qu.:3,280   3rd Qu.:0,5500   3rd Qu.:11,40
##  Max.   :1,0390   Max.   :3,820   Max.   :1,0800   Max.   :14,20
##
##     quality      quality.factor
##  Min.   :3,000   3:  20
##  1st Qu.:5,000   4: 163
##  Median :6,000   5:1457
##  Mean   :5,878   6:2198
##  3rd Qu.:6,000   7: 880
##  Max.   :9,000   8: 175
##                  9:   5
The summary function let us dig into data. Most of the variables, except Residual sugar and alcohol, have means and medians pretty close to each other. At the same time their max values are far from the third quartile (except pH). I guess the distributions of this variables might be normal with outliers on the right tail.
Despite the fact that experts were able to grade the quality of the wine between 0 and 10, wine in the dataset has the quality scores from 3 to 9.
To get more feeling about the data, I'm going to visualize the histrograms of the varibles in the next section.
Univariate Plots Section
The following grid visualize the distributions of provided variables.
Red line represents the median, green - the mean, doted lines are first and third quartiles.
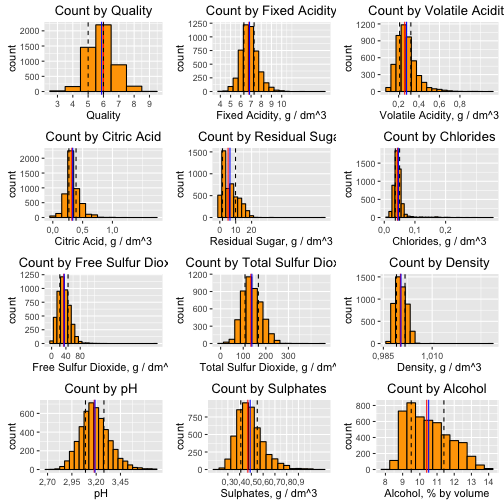
Based on the first histogram, most of the wine in the dataset has quality 6 following by 5 and 7. There are quite a few observations with quality scores 3, 4, 8 and 9. Now I'm going to keep looking at the variables as it is but consider to create a new quality variable to union wine with rare quality scores later on.
As assumed most of the variables (except Residual Sugar and Alcohol) represent simmetrical distribution with the right tails. Residual sugar is distribution is positively skewed, has a peak around 2 g / dm^3 and a long right tail.
For better visualization I trim the long tails and transformthe x axis of Residual Sugar to log10:
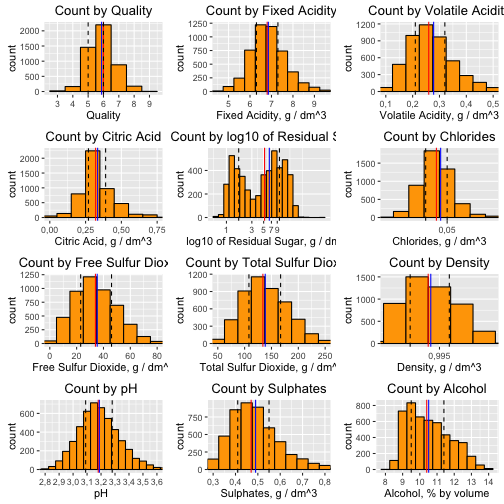
This visualization identifies bi-modal character of the distribution with peaks around 1.5 and 8 g/dm^3.
Univariate Analysis
What is the structure of your dataset?
There are 4898 observations of wine with 12 variables (11 numeric physicochemical properties and one integer expert review).
Other observations:
Most of the wine have quality 5, 6, 7
Most of the wines have pH between 2.80 and 3.47
Median alcohol amount is 10.40%
Average sugar amount is 6.391 g/dm^3 with the maximum 65.80
What is/are the main feature(s) of interest in your dataset?
The main features in the data set are quality, alcohol, residual.sugar, density.
What other features in the dataset do you think will help support your investigation into your feature(s) of interest?
Sulfur dioxide, citric acid, clorides.
Did you create any new variables from existing variables in the dataset?
Yes, I'm going to create new quality variable quality.factor2 to union rare wine with rare quality scores (3, 4, 5 union in "low"; 6 to "average", 7, 8, 9 union in "high")
New variable have 3 groups of wine quality with relatively big amount of observations in each group.
Of the features you investigated, were there any unusual distributions? Did you perform any operations on the data to tidy, adjust, or change the form of the data? If so, why did you do this?
I log-transformed the right skewed Residual Sugar distribution. The tranformed distribution appears bimodal with the peaking around 1 or so and again around 8 g/dm^3.
Bivariate Plots Section
Bivariate Analysis
I would like to start my bivariate analysis with a quick look on the boxplot visualization of our variables against the quality factor and try to get some relatioships:
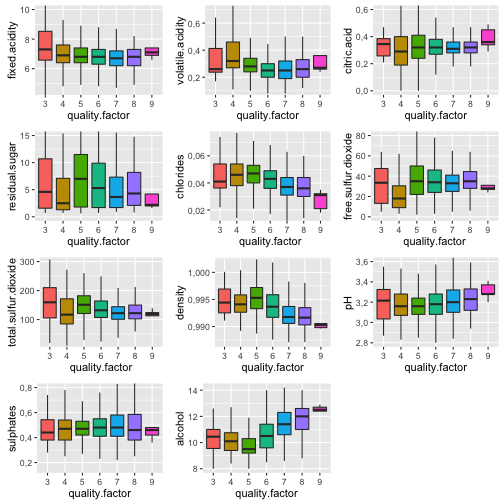
The data variablity of wine with the quality score 9 is really small. It might be because the amount of observations is really small. Here is not to many clear correlations but seems that with the increase of quality alcohol is increasing and density is decreasing.
Let's try the same visualization but with the quality.factor2:
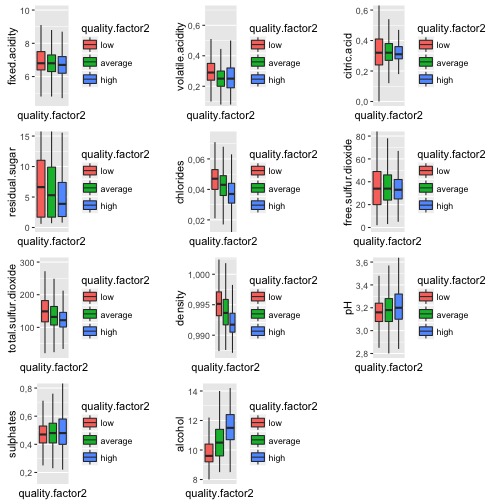
Current plots visualize even better positive correlation betweeb alcohol and quality and negative correlation between density and quality.
Let's visualize density on frequency polygon and color it by quality:
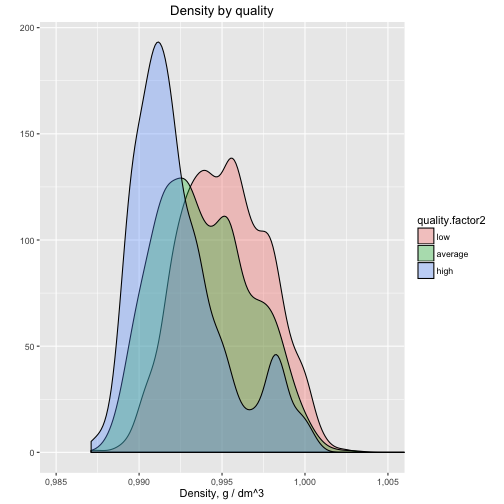
Most quality wine has lower density and it's quite clear on this kind of the visualization.
All other features seems not to be important for the quality.
Talk about some of the relationships you observed in this part of the investigation. How did the feature(s) of interest vary with other features in the dataset?
I had a particular interest in quality exploration. Now it's time to investigate the secrets of wine flavor and check the relationships between physicochemical properties. Let's look now on the other possible correlations between the factors.

We can see the correlations between variables: alcohol and sugar density and sugar density and alcohol sugar and total sulfur dioxide We probably can ignore the correlation between free and total sulfur.dioxide as one variable contains in another
I would like to visualize relationship between alcohol and sugar:
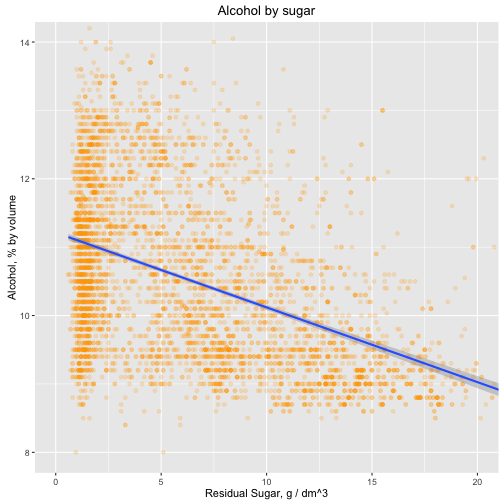
There is some correlation between alochol and sugar. And that's fair enough: sweet wines, whether moelleux (Sweet: 12-45 g/l of sugar) or liquoreux (Fortified: >45 g/l sugar) wines are where the fermentation is interrupted before all the grape sugars are converted into alcohol: this is called Mutage or fortification[1]. That means sweeter the wine (more sugar in the wine) - less alcohol.
Now I'm curious about the correlation between total sulfur dioxide and sugar.
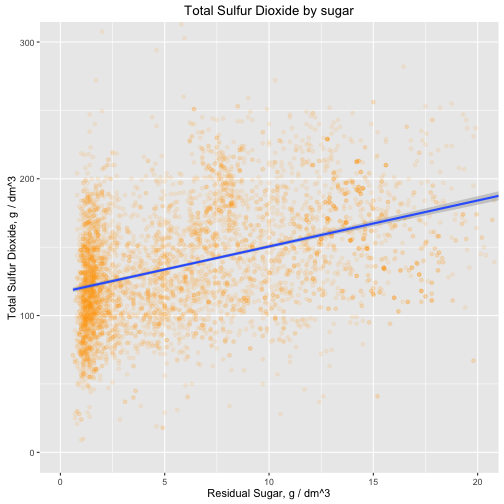
There is also quite a strong correlation between SO2 and sugar. That's because SO2, sulphur dioxide, plays a protective role in the wine against the phenomena of oxidation, oxidase enzyme action (enzymes that oxidize the polyphenols in wine), and the control of microbial populations in yeasts and bacteria (antiseptic effect). The maximum allowable doses depend on the sugar content of the wine: the residual sugar is susceptible to attack by microorganisms which would cause a restart of fermentation.[1]
Did you observe any interesting relationships between the other features (not the main feature(s) of interest)?
Flavor related relationships which is good to know if you're not a sommellier.
What was the strongest relationship you found?
Sugar and density
Multivariate Plots Section
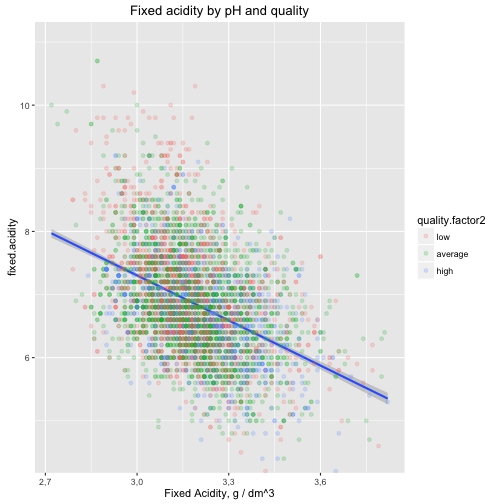
It looks like the better quality wines have lower density with the same sweetness of the wine. There is a negative correlation between Fixed acidity and pH but seems there is no clear influence on quality factor.
Now I'm going to explore density as it has relationships with lot's of other variables. There is a strong positive correlation between density and sugar, negative correlation between quality (remember from previous section) and alcohol. Let's visualize density and try find some logic.
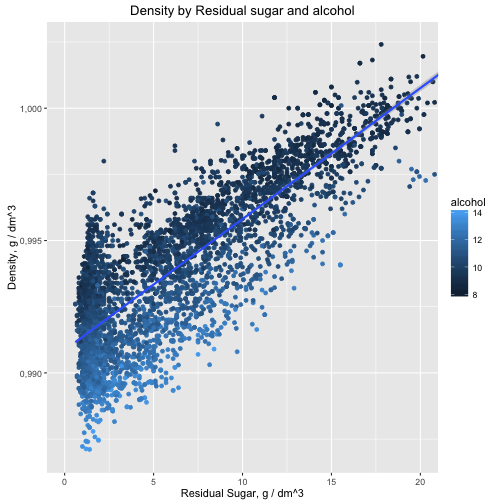
This visualization gives us 2 ideas: sweater wine has more density and wine with the same sweetness has larger volume of alcohol with lower density.
Multivariate Analysis
Talk about some of the relationships you observed in this part of the investigation. Were there features that strengthened each other in terms of looking at your feature(s) of interest?
The most powerful features lies around quality of wine, alcohol and density. Density has also a strong relationship with sugar.
OPTIONAL: Did you create any models with your dataset? Discuss the strengths and limitations of your model.
Based on the exploratory data analysis, the linear regression model doesn't provide any meaningful data.
Final Plots and Summary
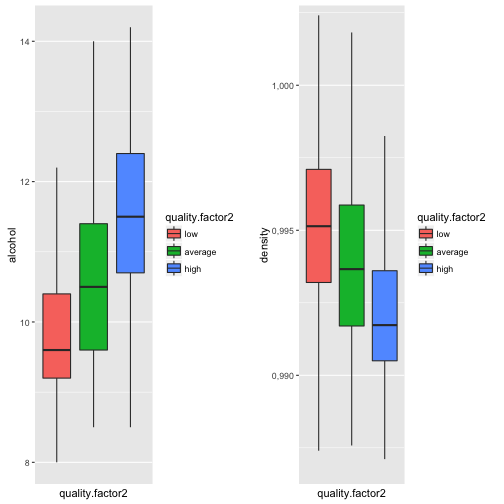
Plot One
Description One
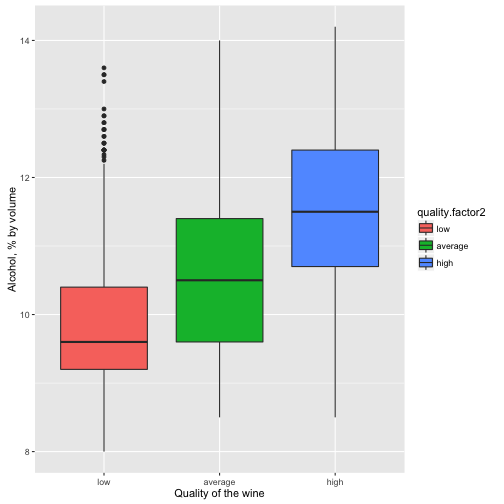
The first plot visualize the strongest relationship between wine and physicochemical properties - alcohol. For clarity we're using here created quality variable, unioned rare quality scores.
That's a surprising outcome but it's tend to be that experts give higher scores to the wine with higher volume of alcohol.
Here are some statistical calculation:
## wine$quality.factor2: low
##    Min. 1st Qu.  Median    Mean 3rd Qu.    Max.
##    8,00    9,20    9,60    9,85   10,40   13,60
## --------------------------------------------------------
## wine$quality.factor2: average
##    Min. 1st Qu.  Median    Mean 3rd Qu.    Max.
##    8,50    9,60   10,50   10,58   11,40   14,00
## --------------------------------------------------------
## wine$quality.factor2: high
##    Min. 1st Qu.  Median    Mean 3rd Qu.    Max.
##    8,50   10,70   11,50   11,42   12,40   14,20
Median alcohol for low quality wines is 9.60 with IQR 1.20.
Median alcohol for average quality wines is 10.50 with IQR 1.80.
Median alcohol for high quality wines is 11.50 with IQR 1.70.
Plot Two and Three

Description Two
Density is an important feature of the wine. Based on our exloratory data analysis, it's second most important for the quality and has negative correlation. The reader can see it clearly on the current visualisation of frequency polygon. The outcome is the following: the better wine tend to have lower density. Now we can know that for the better wine we should consider wine with more alcohol and lower density.
## wine$quality.factor2: low
##    Min. 1st Qu.  Median    Mean 3rd Qu.    Max.
##  0,9872  0,9932  0,9951  0,9952  0,9971  1,0020
## --------------------------------------------------------
## wine$quality.factor2: average
##    Min. 1st Qu.  Median    Mean 3rd Qu.    Max.
##  0,9876  0,9917  0,9937  0,9940  0,9959  1,0390
## --------------------------------------------------------
## wine$quality.factor2: high
##    Min. 1st Qu.  Median    Mean 3rd Qu.    Max.
##  0,9871  0,9905  0,9917  0,9924  0,9936  1,0010
Median density for low quality wines is 0.9951.
Median density for average quality wines is 0.9937.
Median density for high quality wines is 0.9917
Plot Three
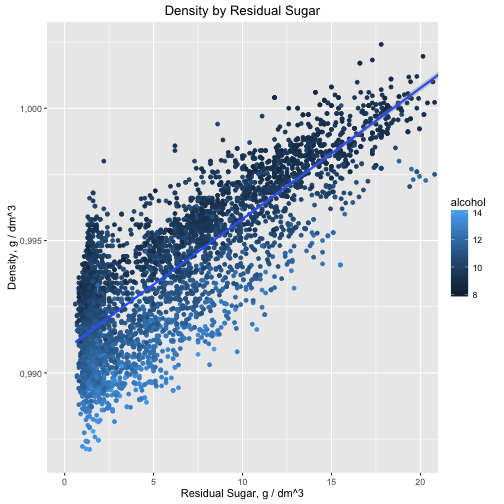
Description Three
We've also found some interesting knowledge in the wine physicochemical properties, exploring correlation of residual sugar, density and alcohol: sweater wine has more density and wine with the same sweetness has larger volume of alcohol with lower density. Anotherwords, looking for the good wine with larger volume of alcohol and knowing what sweetness you like more you could expect lower density.
Reflection
Working on the beautiful diamond dataset in the class, I hope to find the linear model for wine quality as well. It would be a great deal for me as a hotel manager who should be able to choose good wine for the reasonable price not being a sommelier. Now I'm highly motivated to dig into next course and find the algorithm to predict the quality of wine. Still, I got something from this analysis: Good wine tend to have more alcohol. Alcohol probably creates the flavor or sugar (as an alternative to alcohol) kills it Good wine tend to have lower density. Again that might be because of sugar (density increases with the increase of sugar) or SO2. As we know from the description, everyone uses SO2 but too much of it might harm the wine and increase density
Limitations of the study It's important to identify and acknowledge the limitation of the study. Correlation doesn't imply causation. My conclusions are based just on the provided data set. To get the real causation, I should conduct the controlled experiment which is most probably not possible. Using sample instead of the population. Our data set represent just several thousands wine from particular region. Measures used to collect the data. The quality review is a person opinion of the particular sommelier.
References:
- White wine: https://en.wikipedia.org/wiki/White_wine
Comments
comments powered by Disqus